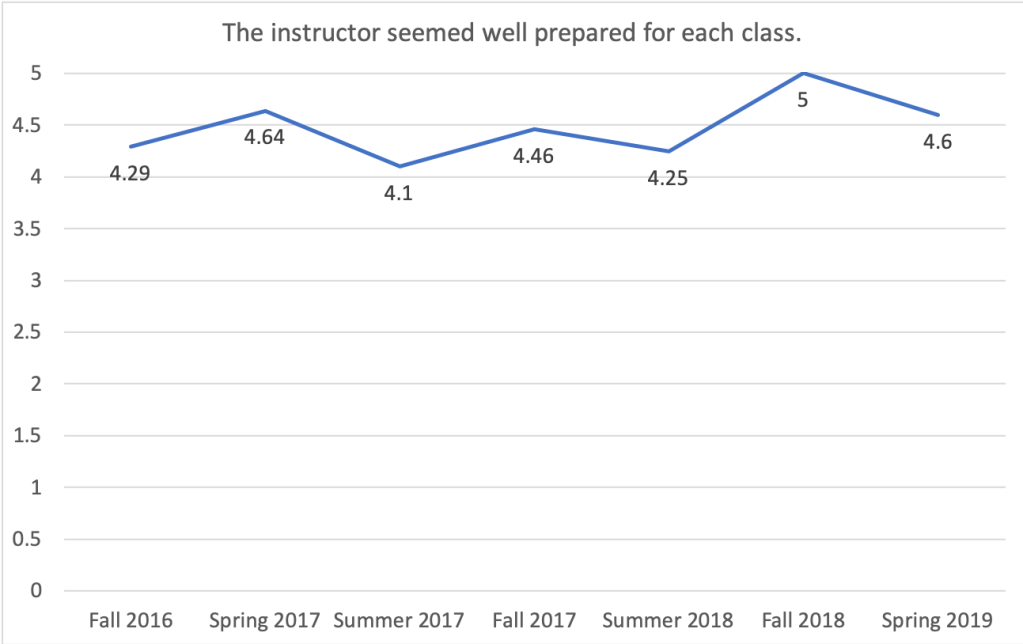
I’m still in the process of adding to this page, as I have some really cool ideas for visualizing the past three years of student data. The current graphs give data points for the item mean since fall of 2016.
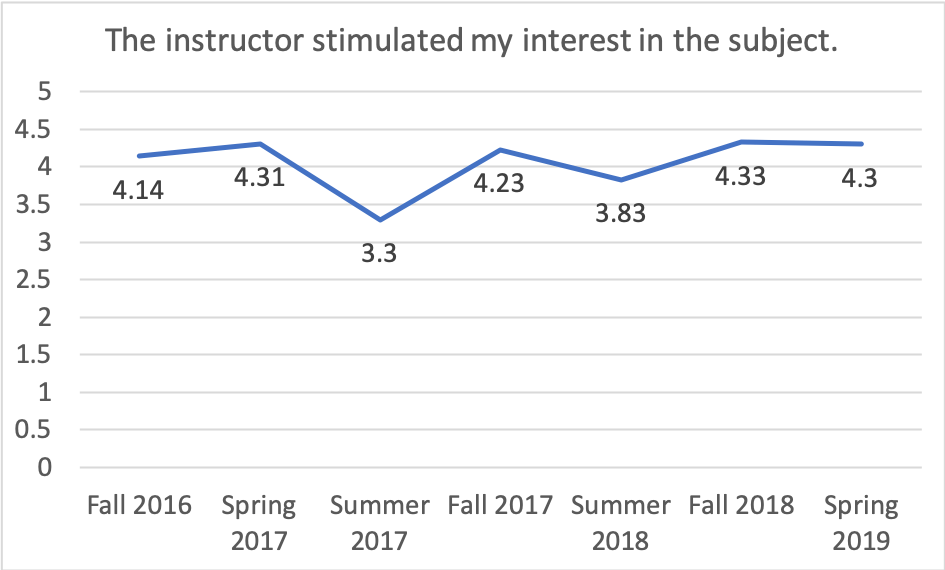
Summer 2017 was my first time co-teaching this course. I admit that coordinating between each other probably made it seem like we weren’t prepared. But I seem to have been doing better recently! The summer semester is between 5-7 weeks long, and for the past few years the course has been taught during Ramadan. I think I can blame part of the low summer scores on that. I also wonder to what extent this course is more helpful after students get to industry. I would like to do some more investigating and reflection on how to help engineering students be more interested in writing. I’ve usually done quite well in this category. Summer 2017 had a little dip, but the vast majority of students perceived that I wanted them to learn. I’ve also historically done quite well in enthusiasm. I’m curious about how this graph follows roughly the same pattern as “students find the material interesting,” but the scores are a little higher for my enthusiasm than for their interest.
This YouTube playlist is a compilation of my students’ projects over the years. Their instructions for this video were to collaborate on a Kickstarter video that persuades the audience to invest in their project idea.